High-resolution evaporation values - basics and results from 2018
Authors: Rainer Schlepphorst, Beate Zimmermann, Veikko Junghans and Michael Hauboldt-Rosar (FIB e.V.)
The measurement of plant temperatures for the assessment of water suction has the following background: During transpiration, plants evaporate water via the stomata. Evaporation is the transition from liquid to gaseous phase, below the boiling point at which hydrogen bonds are broken. The energy required for this process is taken from the environment in the form of heat. This causes the leaf surface to cool down.
While leaf surfaces of plants that are sufficiently supplied with water and therefore transpire fully are cooler than the temperature of the ambient air, stressed plants with limited water supply do not have a clear cooling effect or are even warmer than the ambient air. In addition to the water supply, climatic factors also influence the level of transpiration, in particular the vapour pressure deficit of the air, i.e. the capacity of the air to absorb water. This is usually higher in dry periods and with more or less unrestricted solar radiation than in cloudy weather conditions or after a rainy period.
For an irrigation control, which should orient itself at the actual water-demand of the plants, the information of the leaf-temperature alone is therefore not sufficient. There are various solutions to this problem. In the project, the current evapotranspiration of the plant population is derived because it can be used directly to calculate the required watering.
In the irrigation control model IRRIGAMA Steering, which was further developed in the project from the model BEREST 90 and is used for irrigation control on the practical trial shots, the determination of irrigation times and amounts from the consideration of different parameters takes place. Among other things, the current evapotranspiration is calculated from meteorological factors, the calculated soil water supply and stored plant stand information such as type of fruit or stage of development. However, it is not measured and verified in the stand. In IRRIGAMA Steering a possibility has been created in the course of the project to integrate external information on the AET in order to calibrate the model. The approach in the project is therefore to use infrared thermography to determine the actually prevailing AET on the basis of the leaf temperatures and to include it as a correction factor in IRRIGAMA Steering.
- infrared thermography
Leaf temperatures as a stress indicator can be measured selectively with leaf thermometers. Thermal imaging cameras (infrared cameras), which cover the range of the electromagnetic wavelength spectrum from approx. 8 to 14 µm, are suitable for a flat image, such as is useful for irrigation control on arable land.
With the help of a UAV (octocopter), photographs of the plant populations are therefore produced in the project along flight routes on the field trial fields with a thermal imaging camera and a camera that only records the red and near-infrared part of the light spectrum.
- data processing
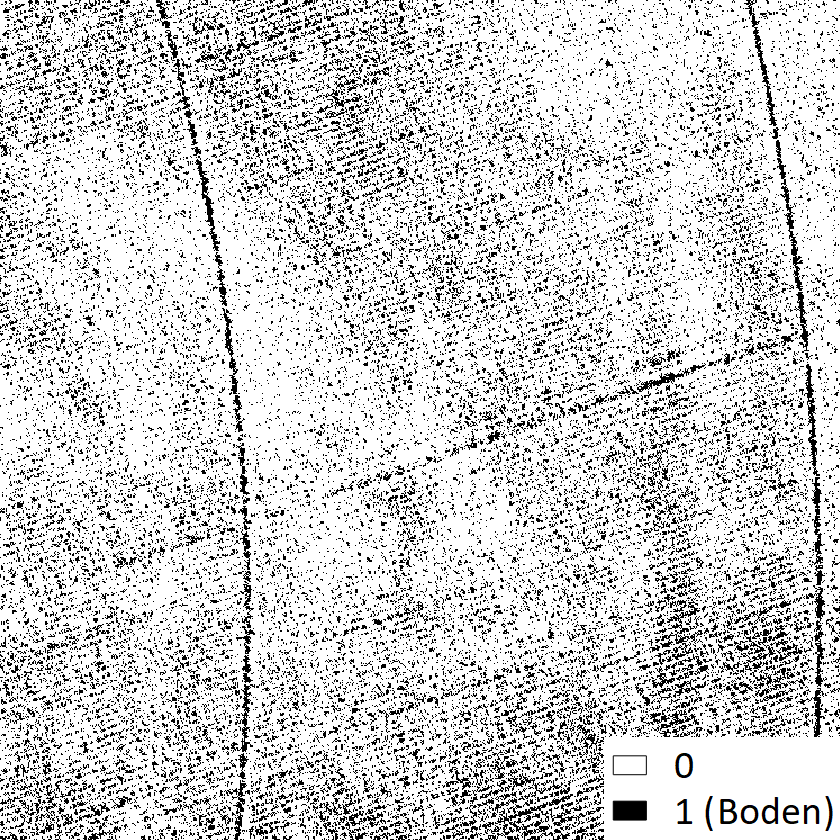
A considerable part of the raster cells or pixels in the images of the thermal imaging camera are mixed pixels due to the relatively low resolution. They contain a certain, unknown proportion of plants and a further proportion that is not one of the plants to be observed, for example soil or accompanying vegetation. For irrigation control, however, only the information of the cultivated plants is of interest.
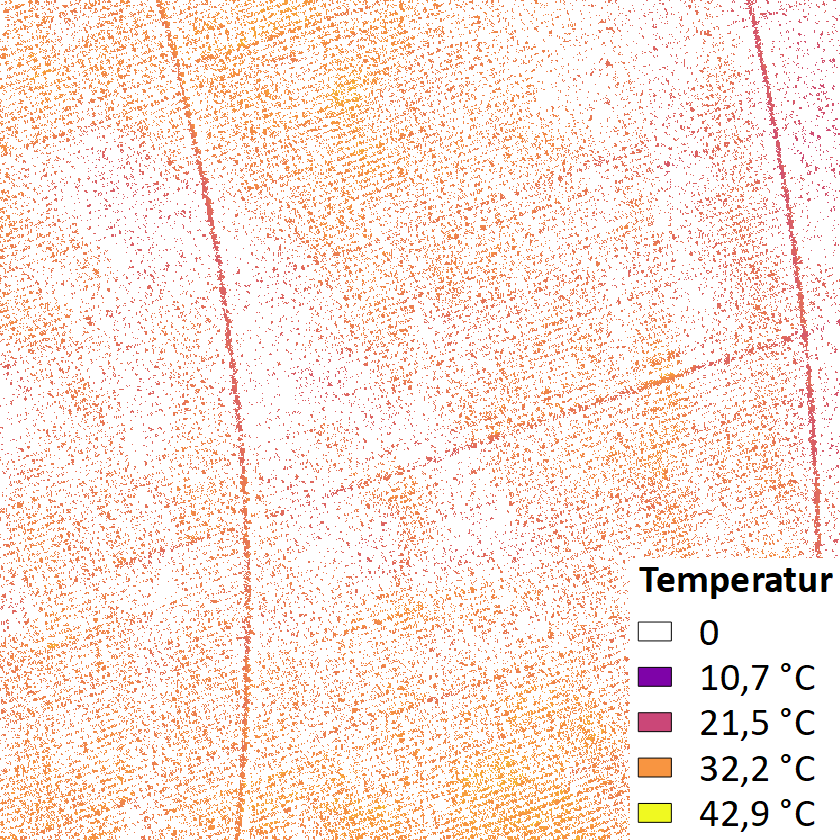
Comprehensive calculations produce both pure plant and pure soil temperature images.
- Two source energy balance (TSEB) model
The two temperature orthomosaics are central input variables in the TSEB energy balance model, with which the current evapotranspiration of a concrete surface can be calculated. The temperature-based Two-Source-Energy-Ballace-Model divides the energy fluxes and the evapotranspiration over a plant population into a plant-based and a soil-borne part and allows to estimate the evaporation of the soil and the transpiration of the plants separately. The approach was developed by Norman & Kustas et. al (1995).
First results
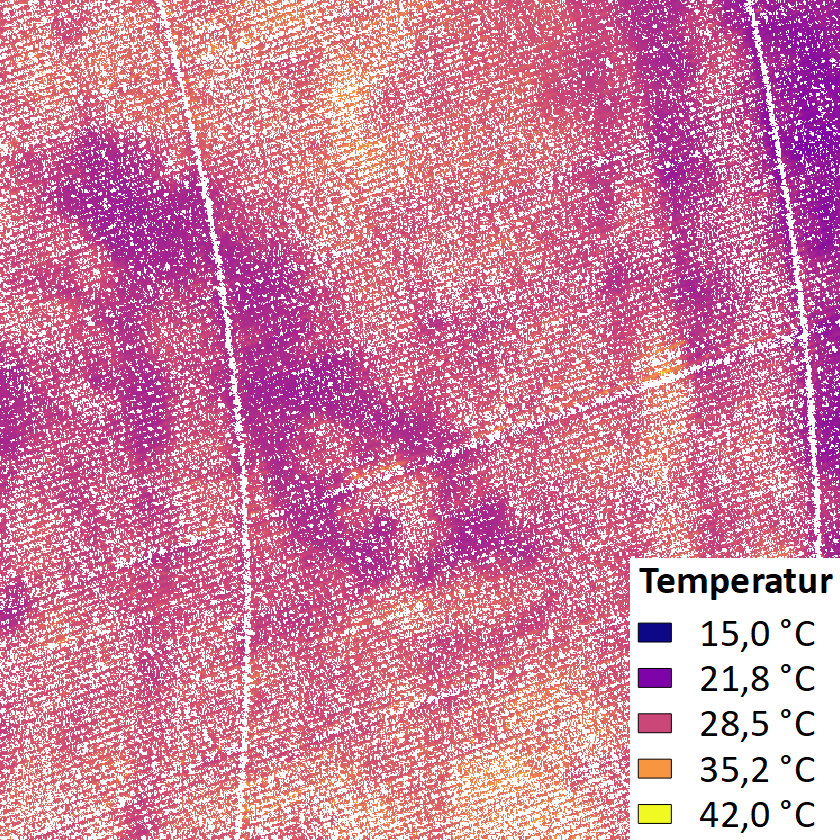
In the project first calculations could be carried out with the existing and already evaluated UAV data. The calculation of the AET on the Schöllnitz field test on 09.07.2018 has a resolution of 5 m per grid cell. The AET of the maize stand fluctuated between about 0 and 7 mm.
However, the further processing of the data from the two cameras is very time-consuming, so that results for the integration of the temperature-based AET in IRRIGAMA steering are not expected until 2019.
- Outlook and significance for practice
The economic evaluation of a site-specific irrigation system is another important project task. The cost-benefit analysis of irrigation worthiness is based, among other things, on the recording of yields in sub-area-specific, uniform and non-irrigated areas and the corresponding full and partial cost accounting. The effects on water and energy consumption compared to conventional irrigation are also determined in order to estimate the environmental performance of the new method. Initial results have been obtained, but at least one further irrigation season must be waited for in order to be able to make reliable statements. Finally, recommendations for action on sub-area-specific irrigation and irrigation control for agricultural enterprises in Brandenburg and comparable regions will be developed.


-
- Bodentemperaturen
-
- Bestandstemperaturen
-
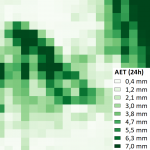
- abgeleiteter 24h Verdunstungswert


Weather data - Precipitation and evaporation - An uncertainty factor?
In order to model the water demand of agricultural crops, it is necessary to consider future relevant events, both potential evapotranspiration and precipitation. These events are generated by metoerological models with unavoidable inaccuracies. Therefore, there is often a deviation between forecast values and actual events. Therefore, the project also examined which forecast errors are to be expected.
The values of the forecast for precipitation and the potential evapotranspiration (PET) were checked with the events that actually occurred. For the events that occurred, the RADOLAN data were used for precipitation and the AMBAV values of the DWD were used for the PET values.
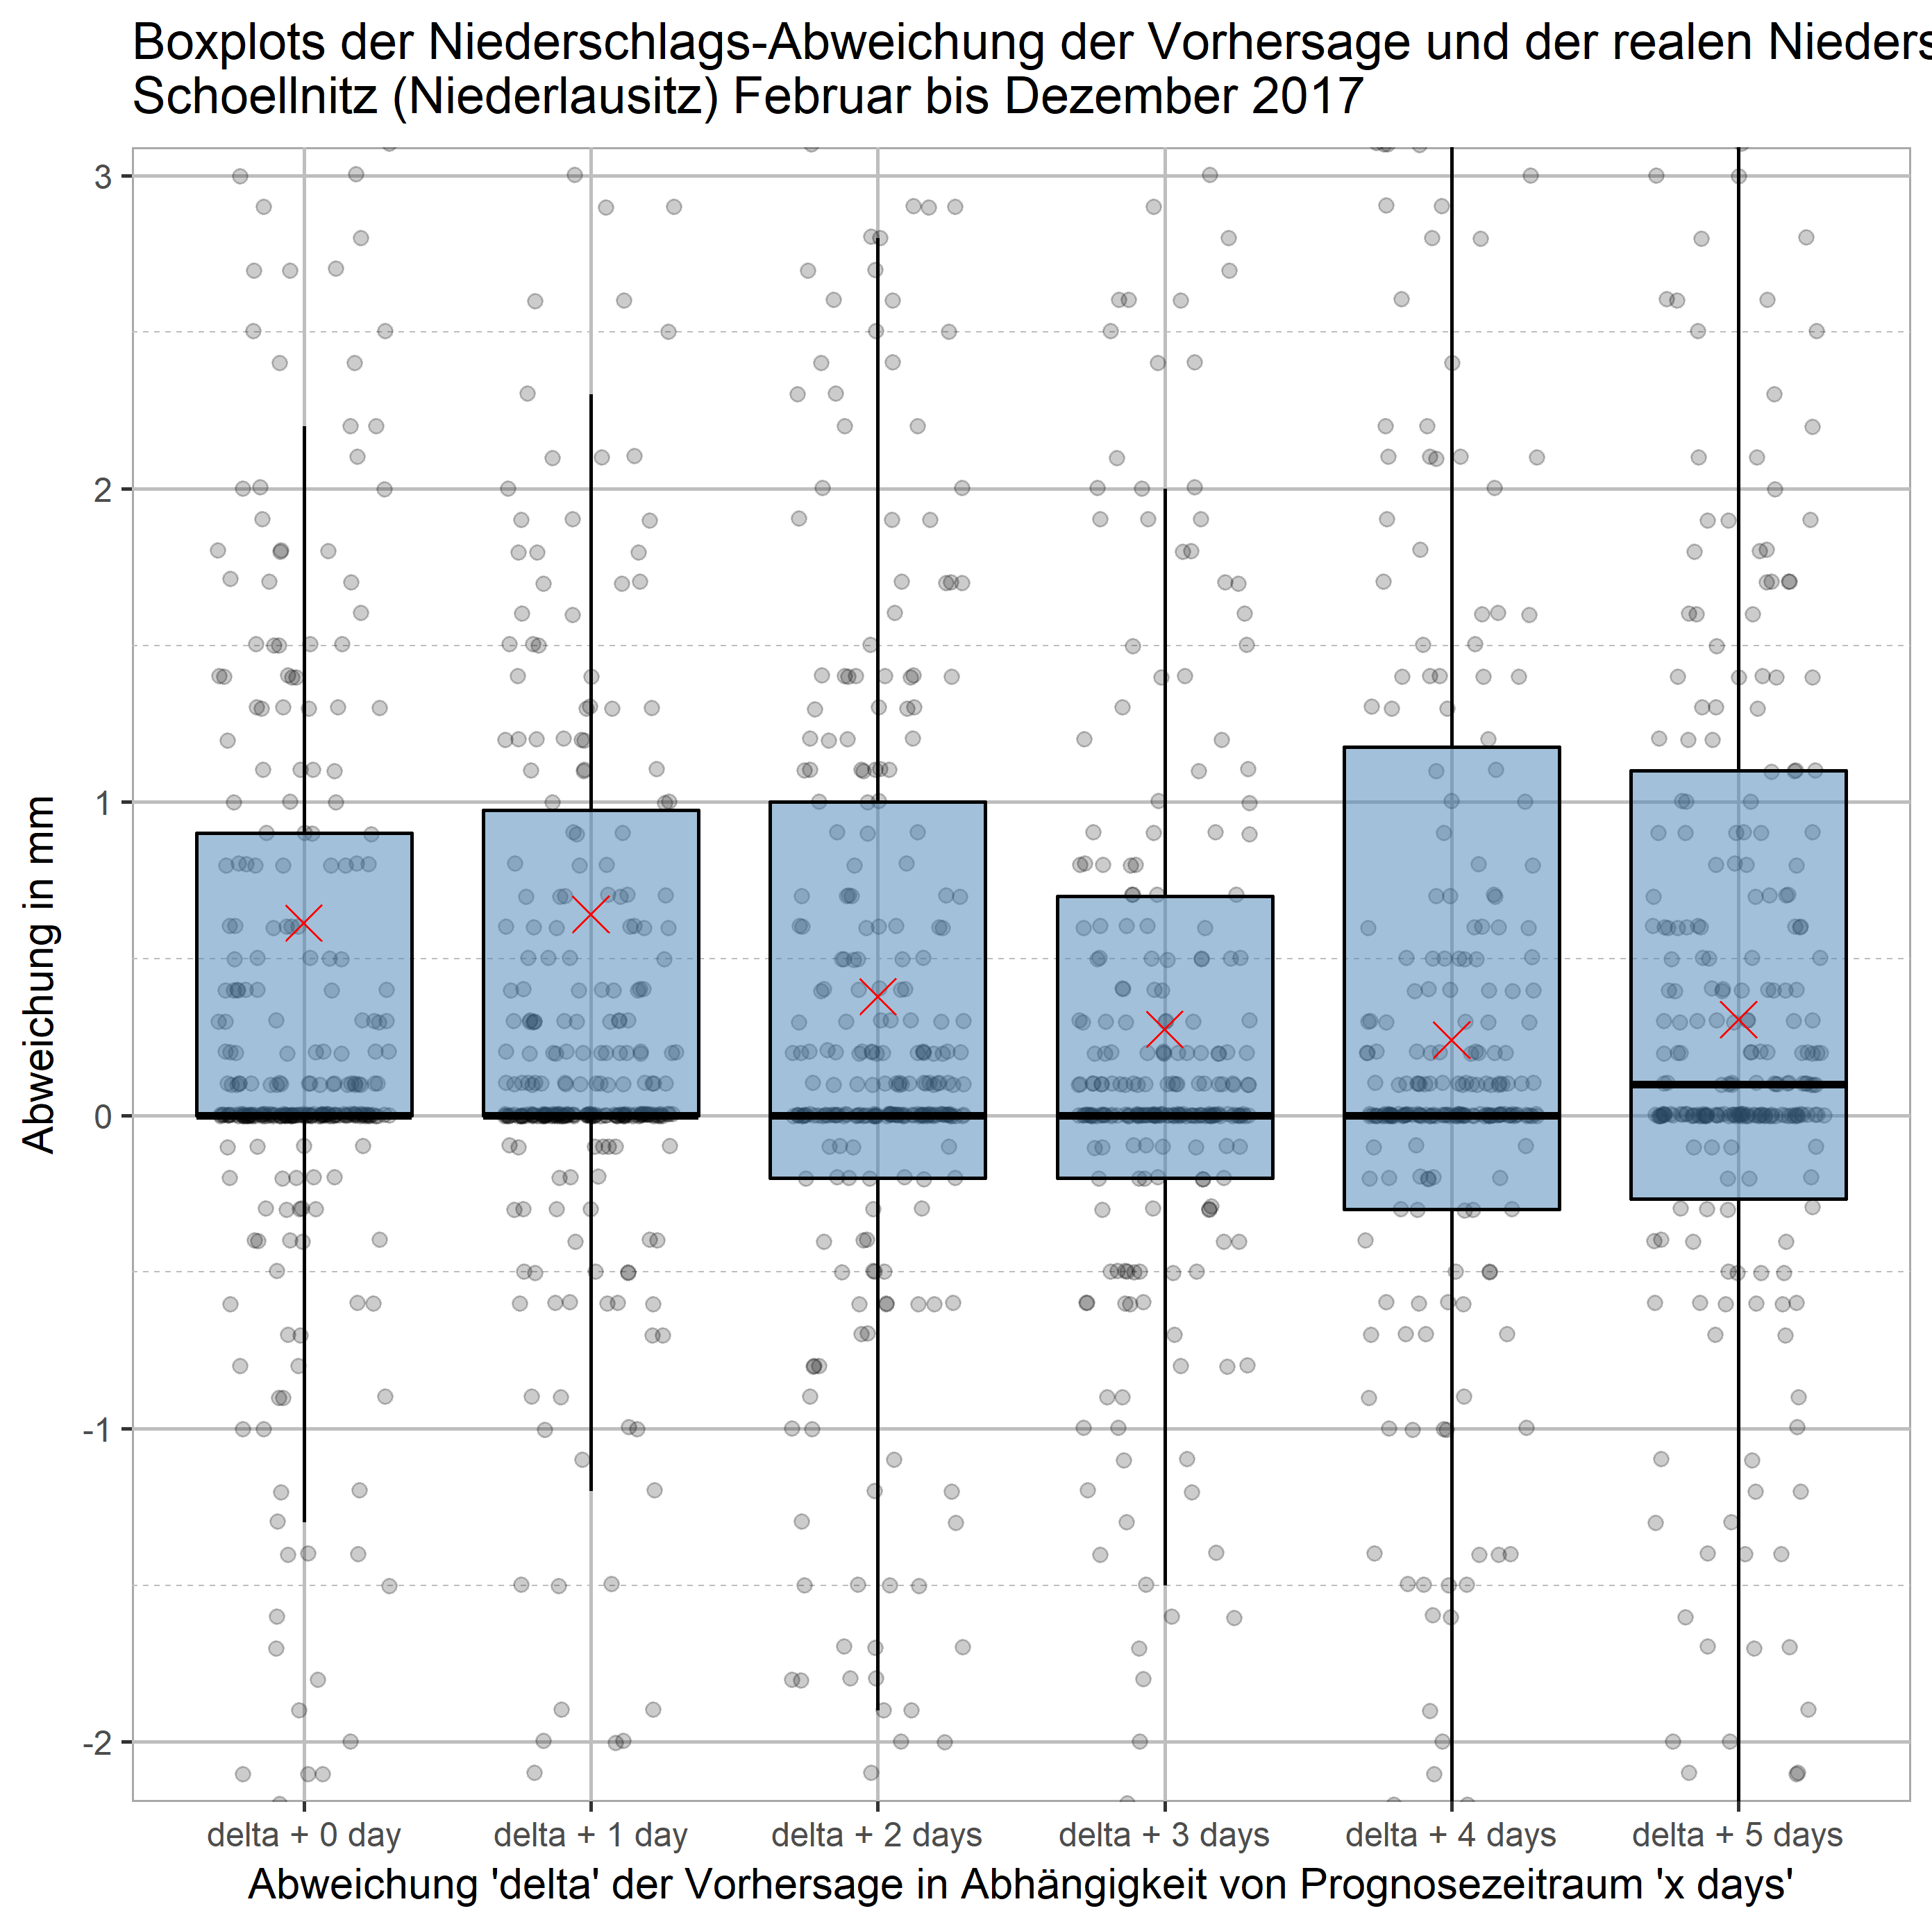
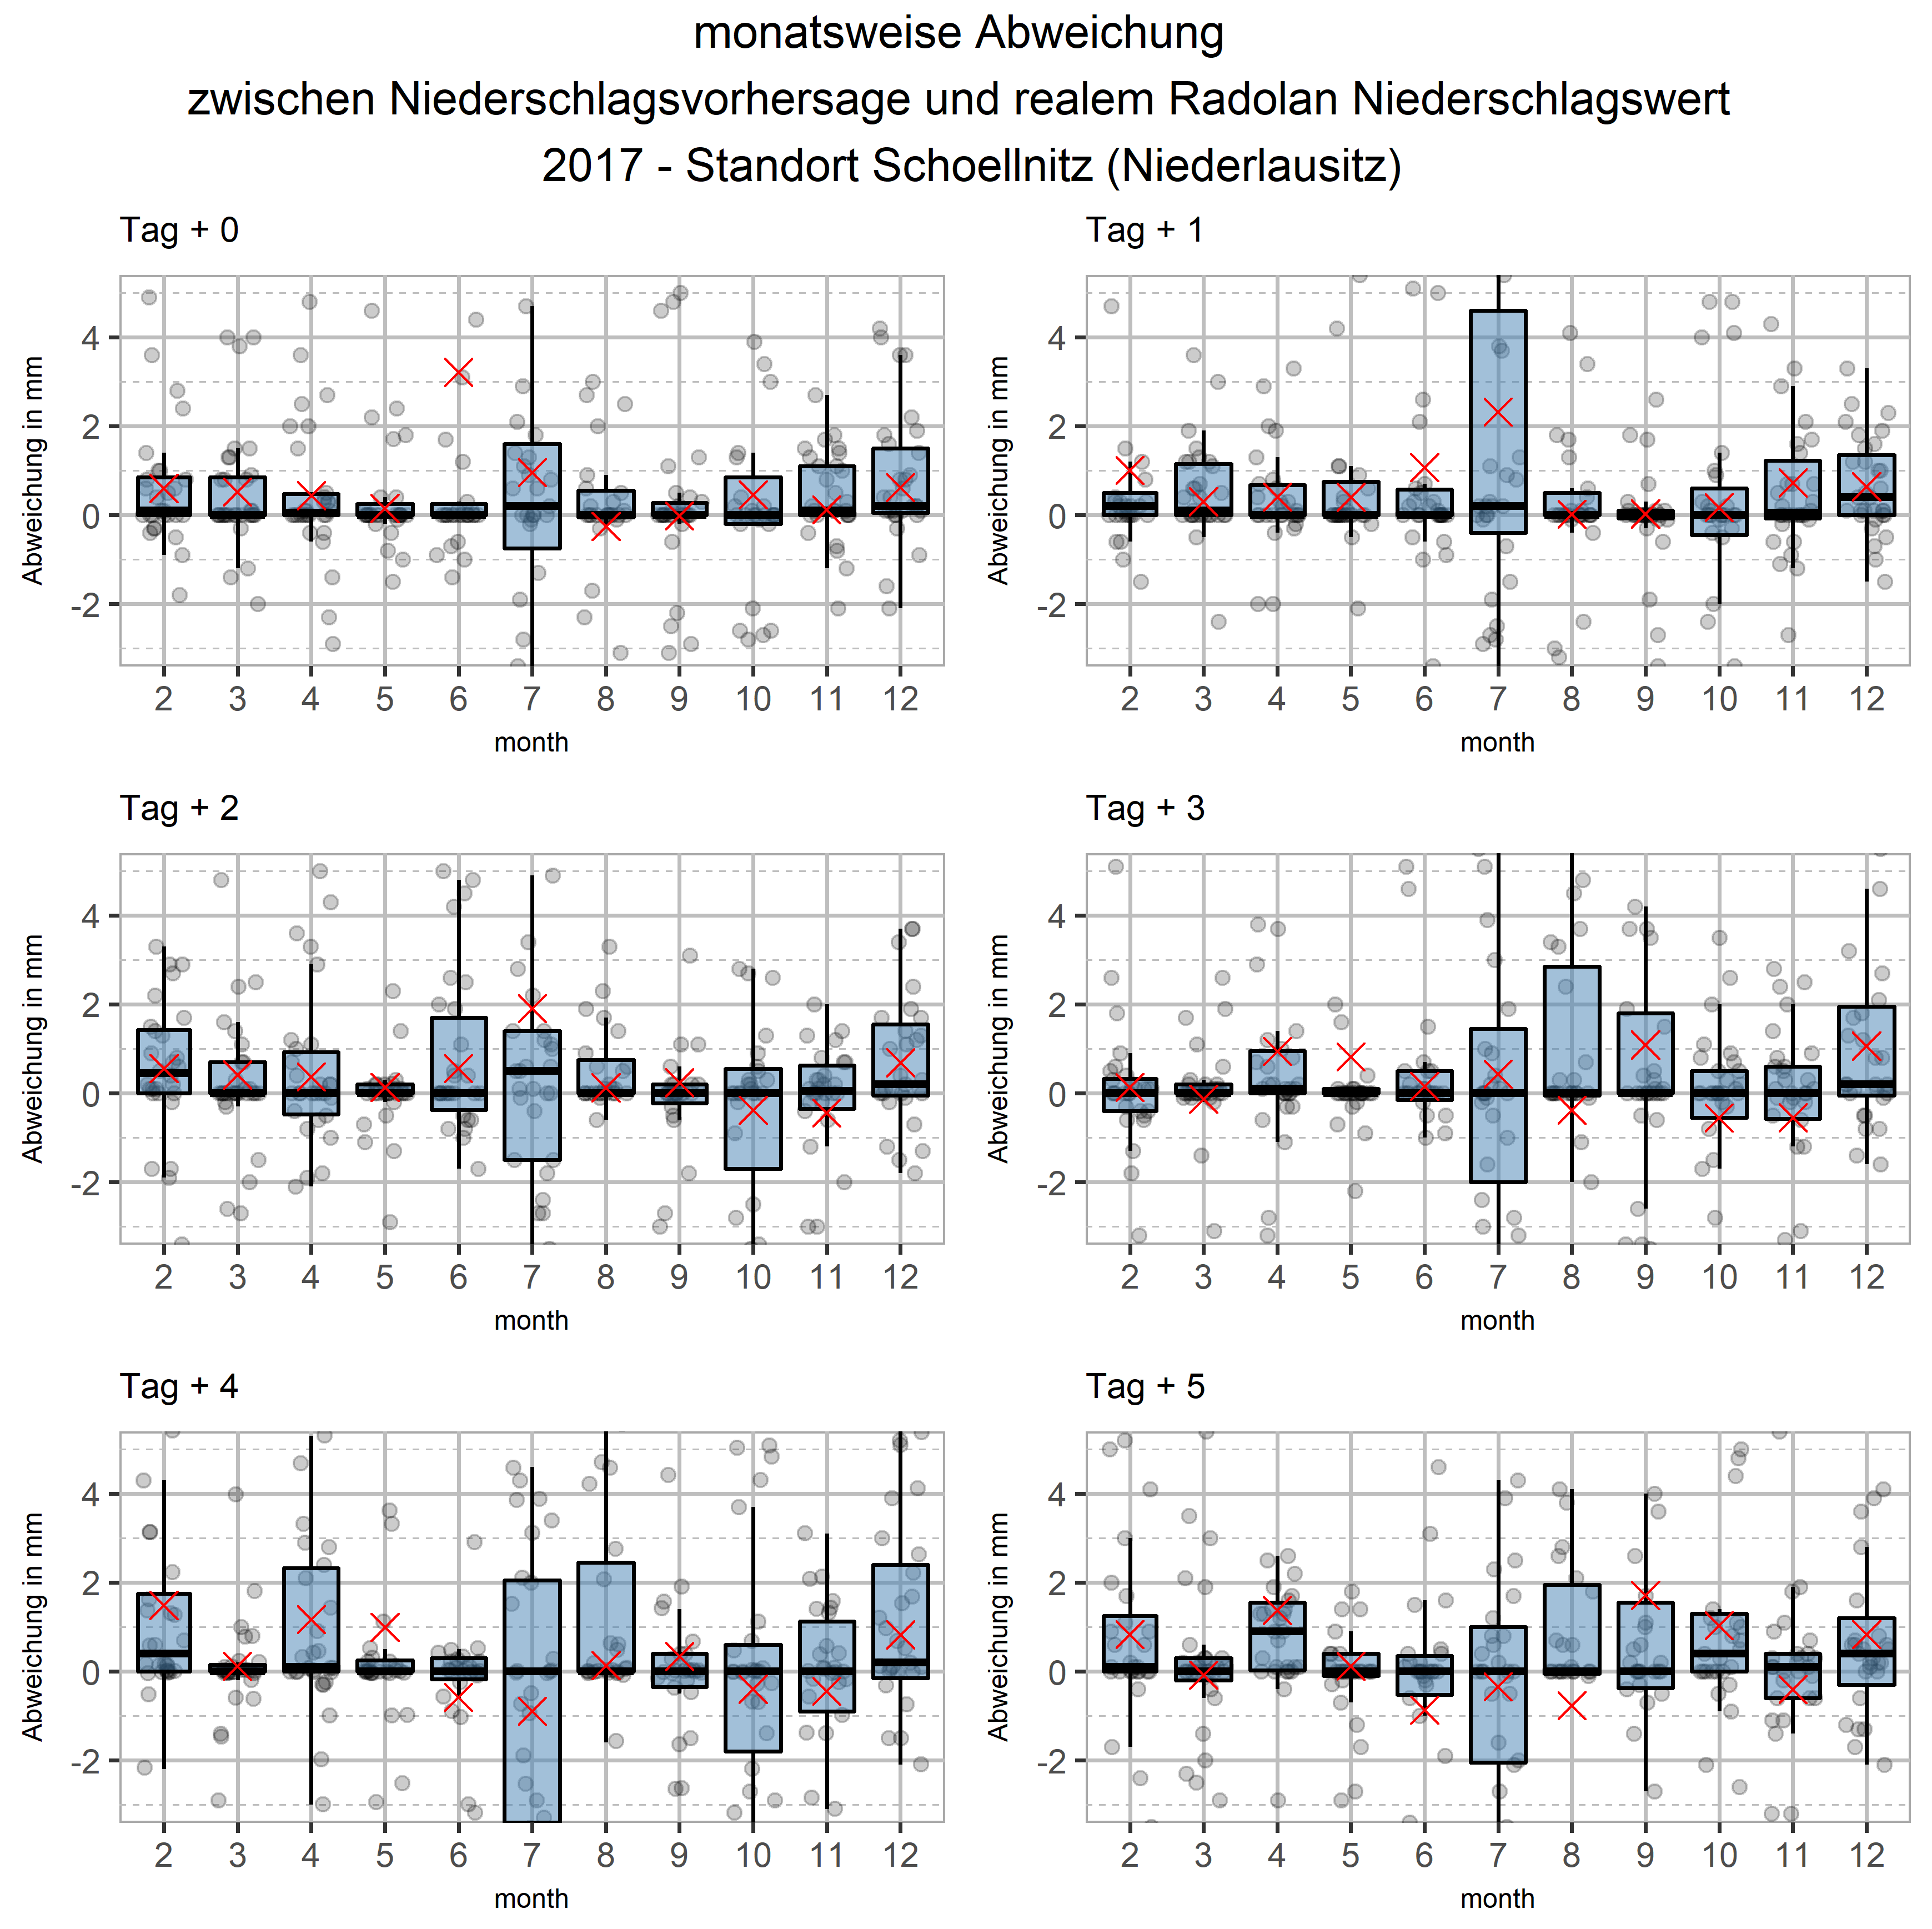
Precipitation
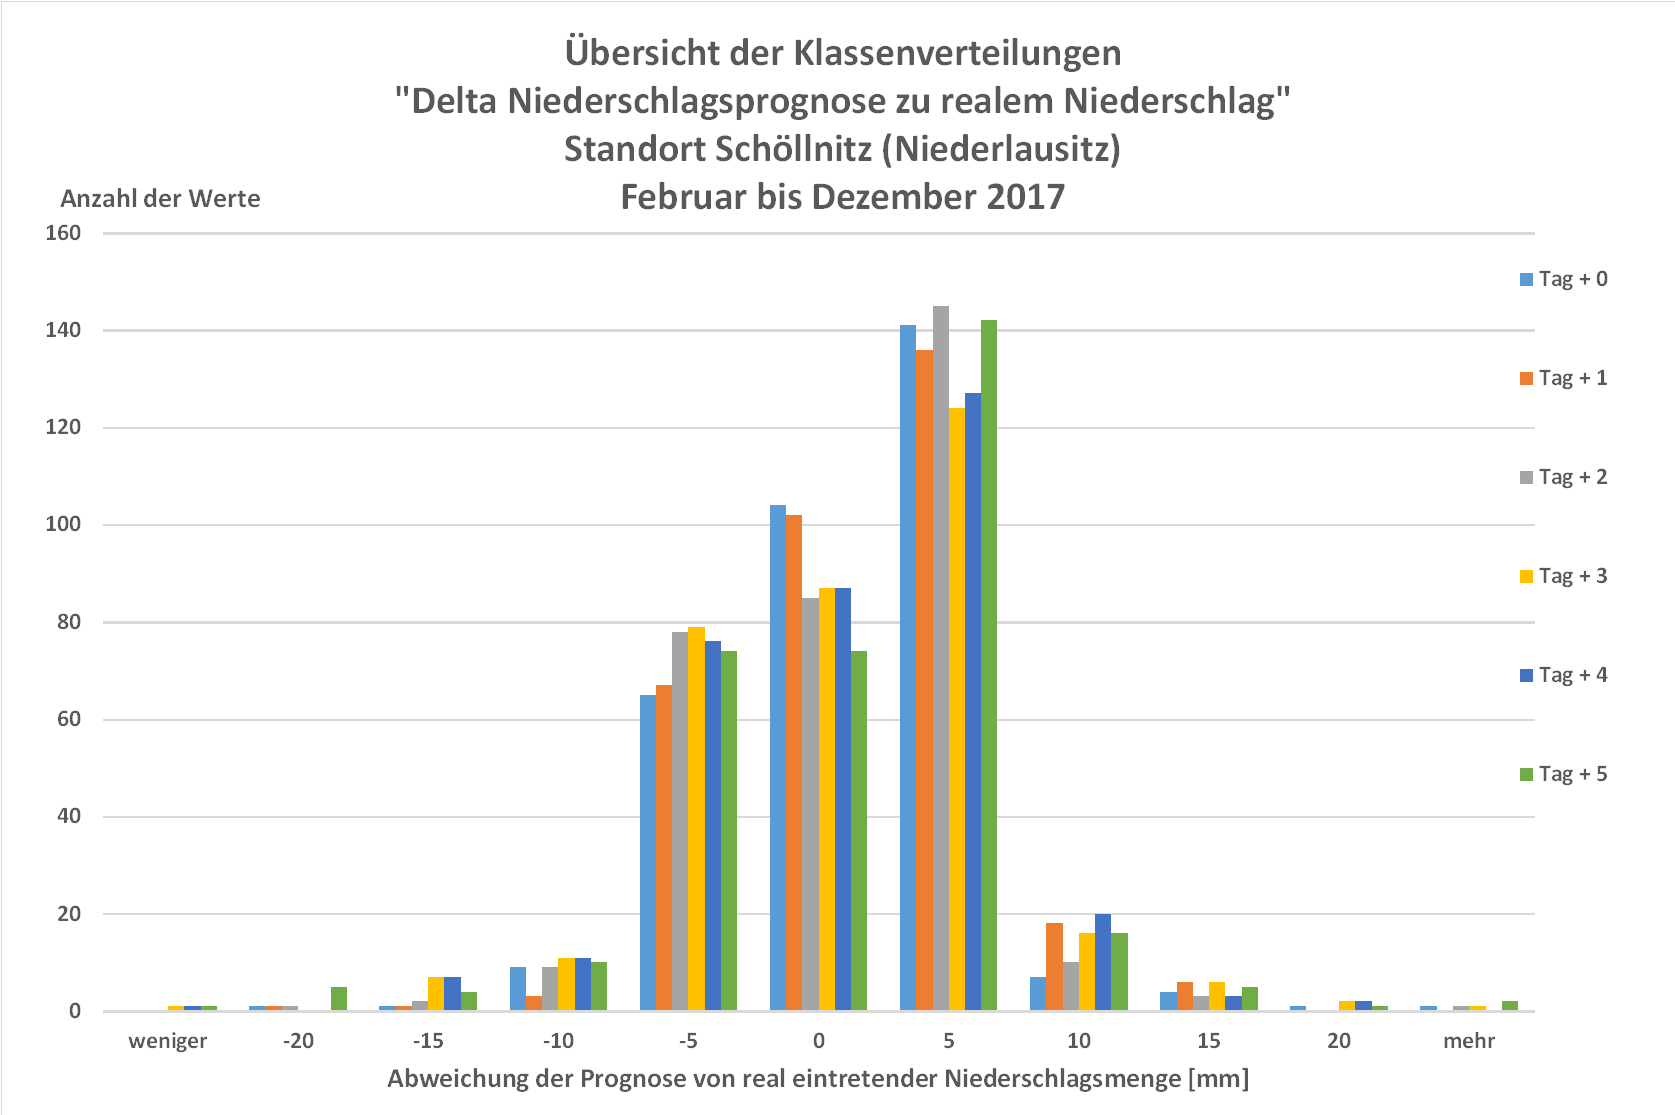
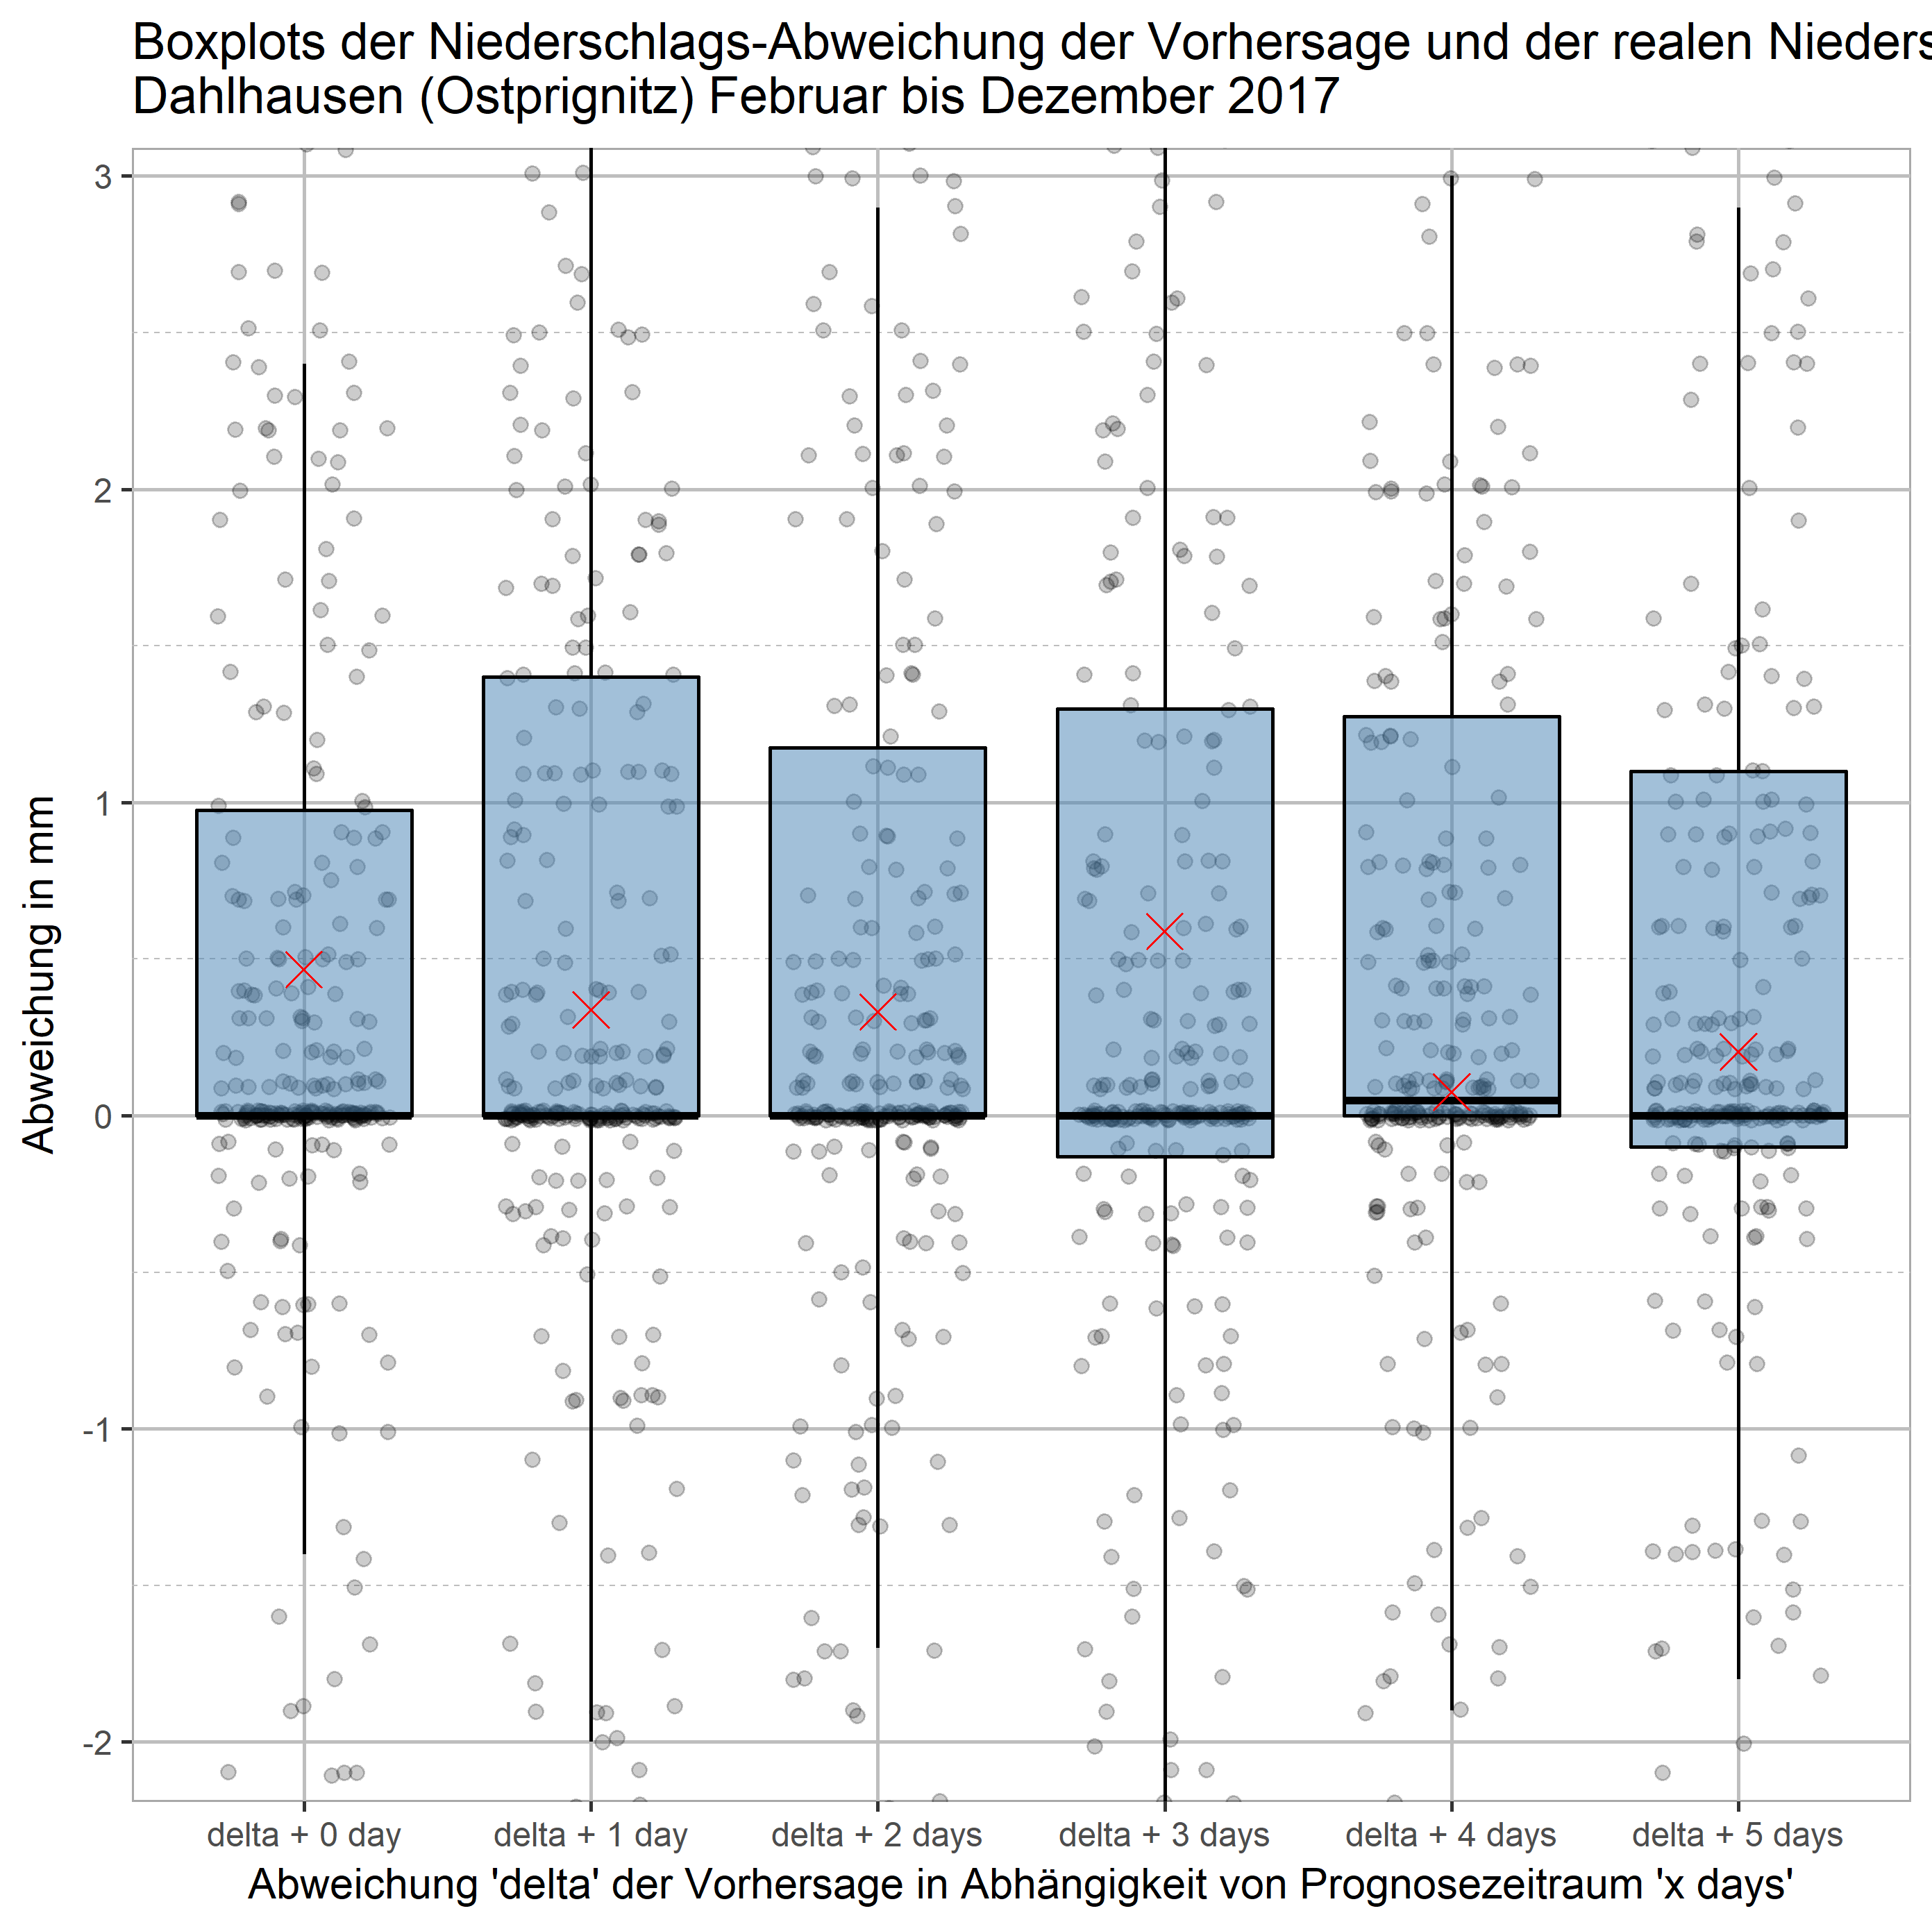
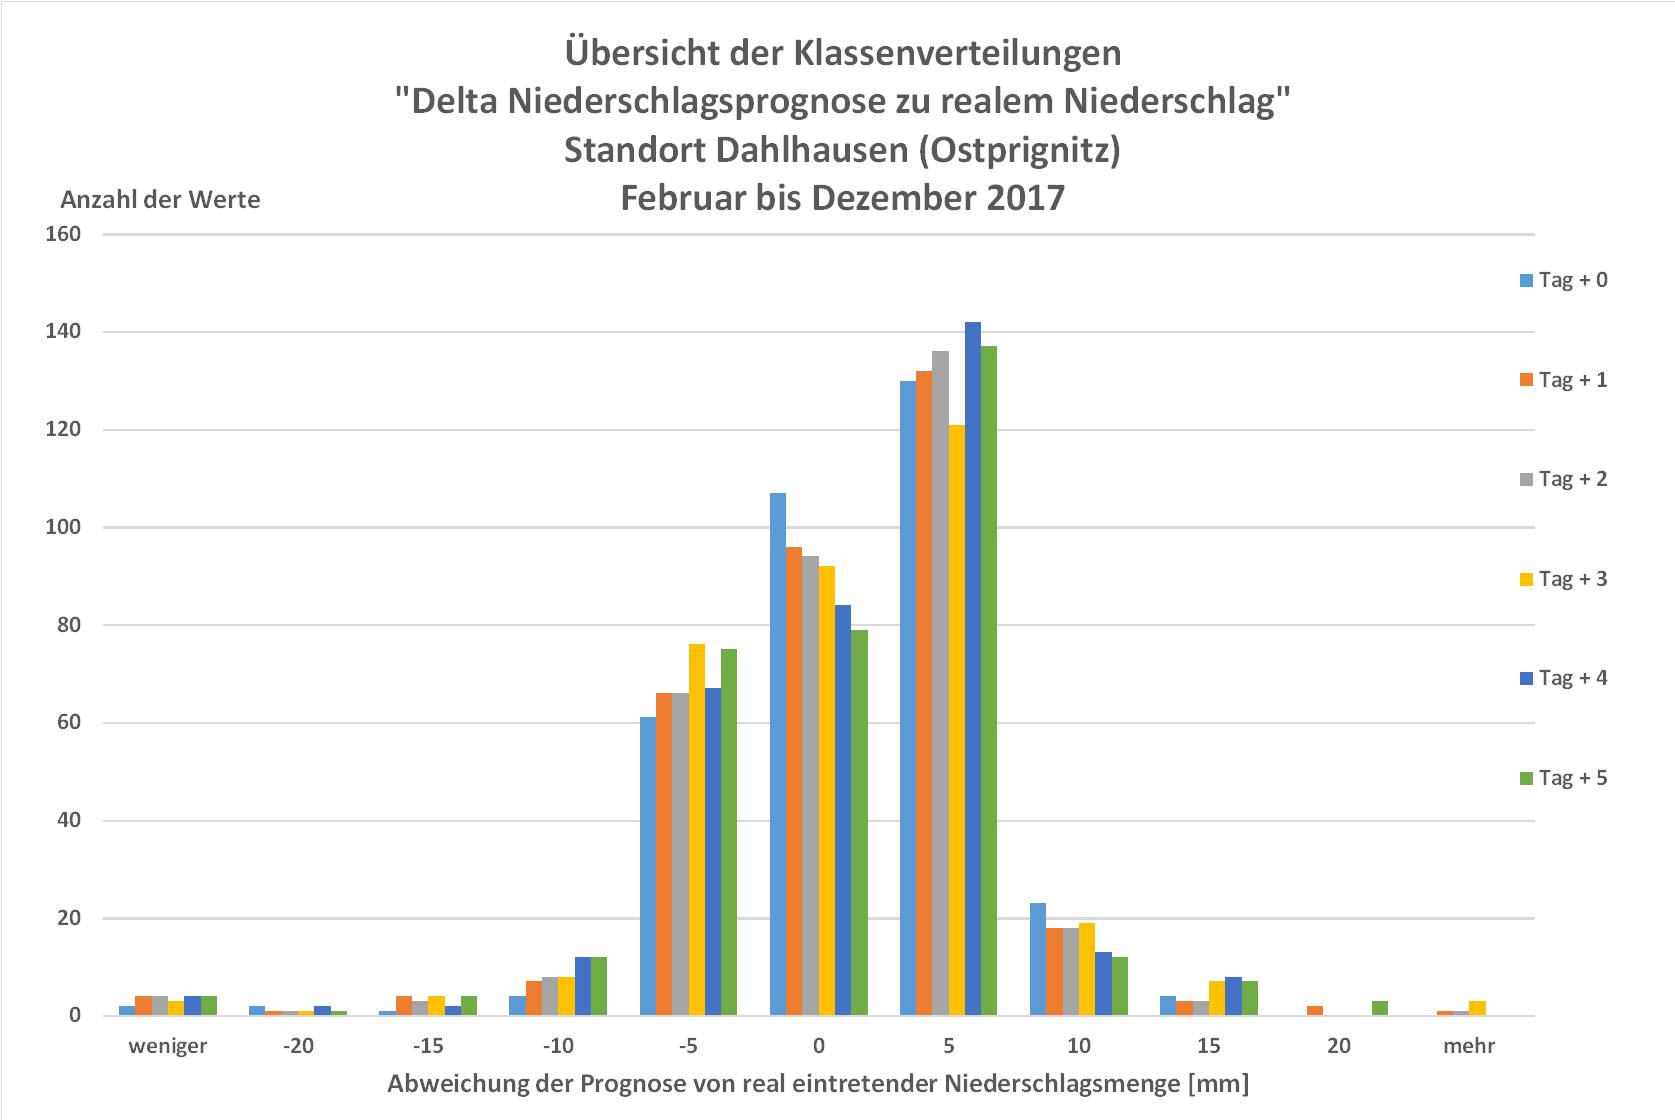
The evaluation showed that the modelled/forecast values of precipitation over a period of 6 days in advance predict the events that then occur with surprisingly high accuracy. The observation period here is February to December 2017.
The following statements have to be made
- In principle, the events that have occurred over the entire forecast period are slightly overestimated.
- The exact forecast of the events is about 25 – 30% (deviation = 0mm).
- 50% of the predictions usually cover a range from 0 to approx. 1mm.
- 75% of the predictions cover a range from -2 to +3mm.
- approx. 87-90% of the predictions cover a range from -5 to +5mm with slightly decreasing accuracy with increasing prediction distance.
- In Niederlausitz, the mean deviations of the predictions are apparently less pronounced than those for Ostprignitz.
- Over 90% of missing precipitation or low precipitation is correctly predicted.
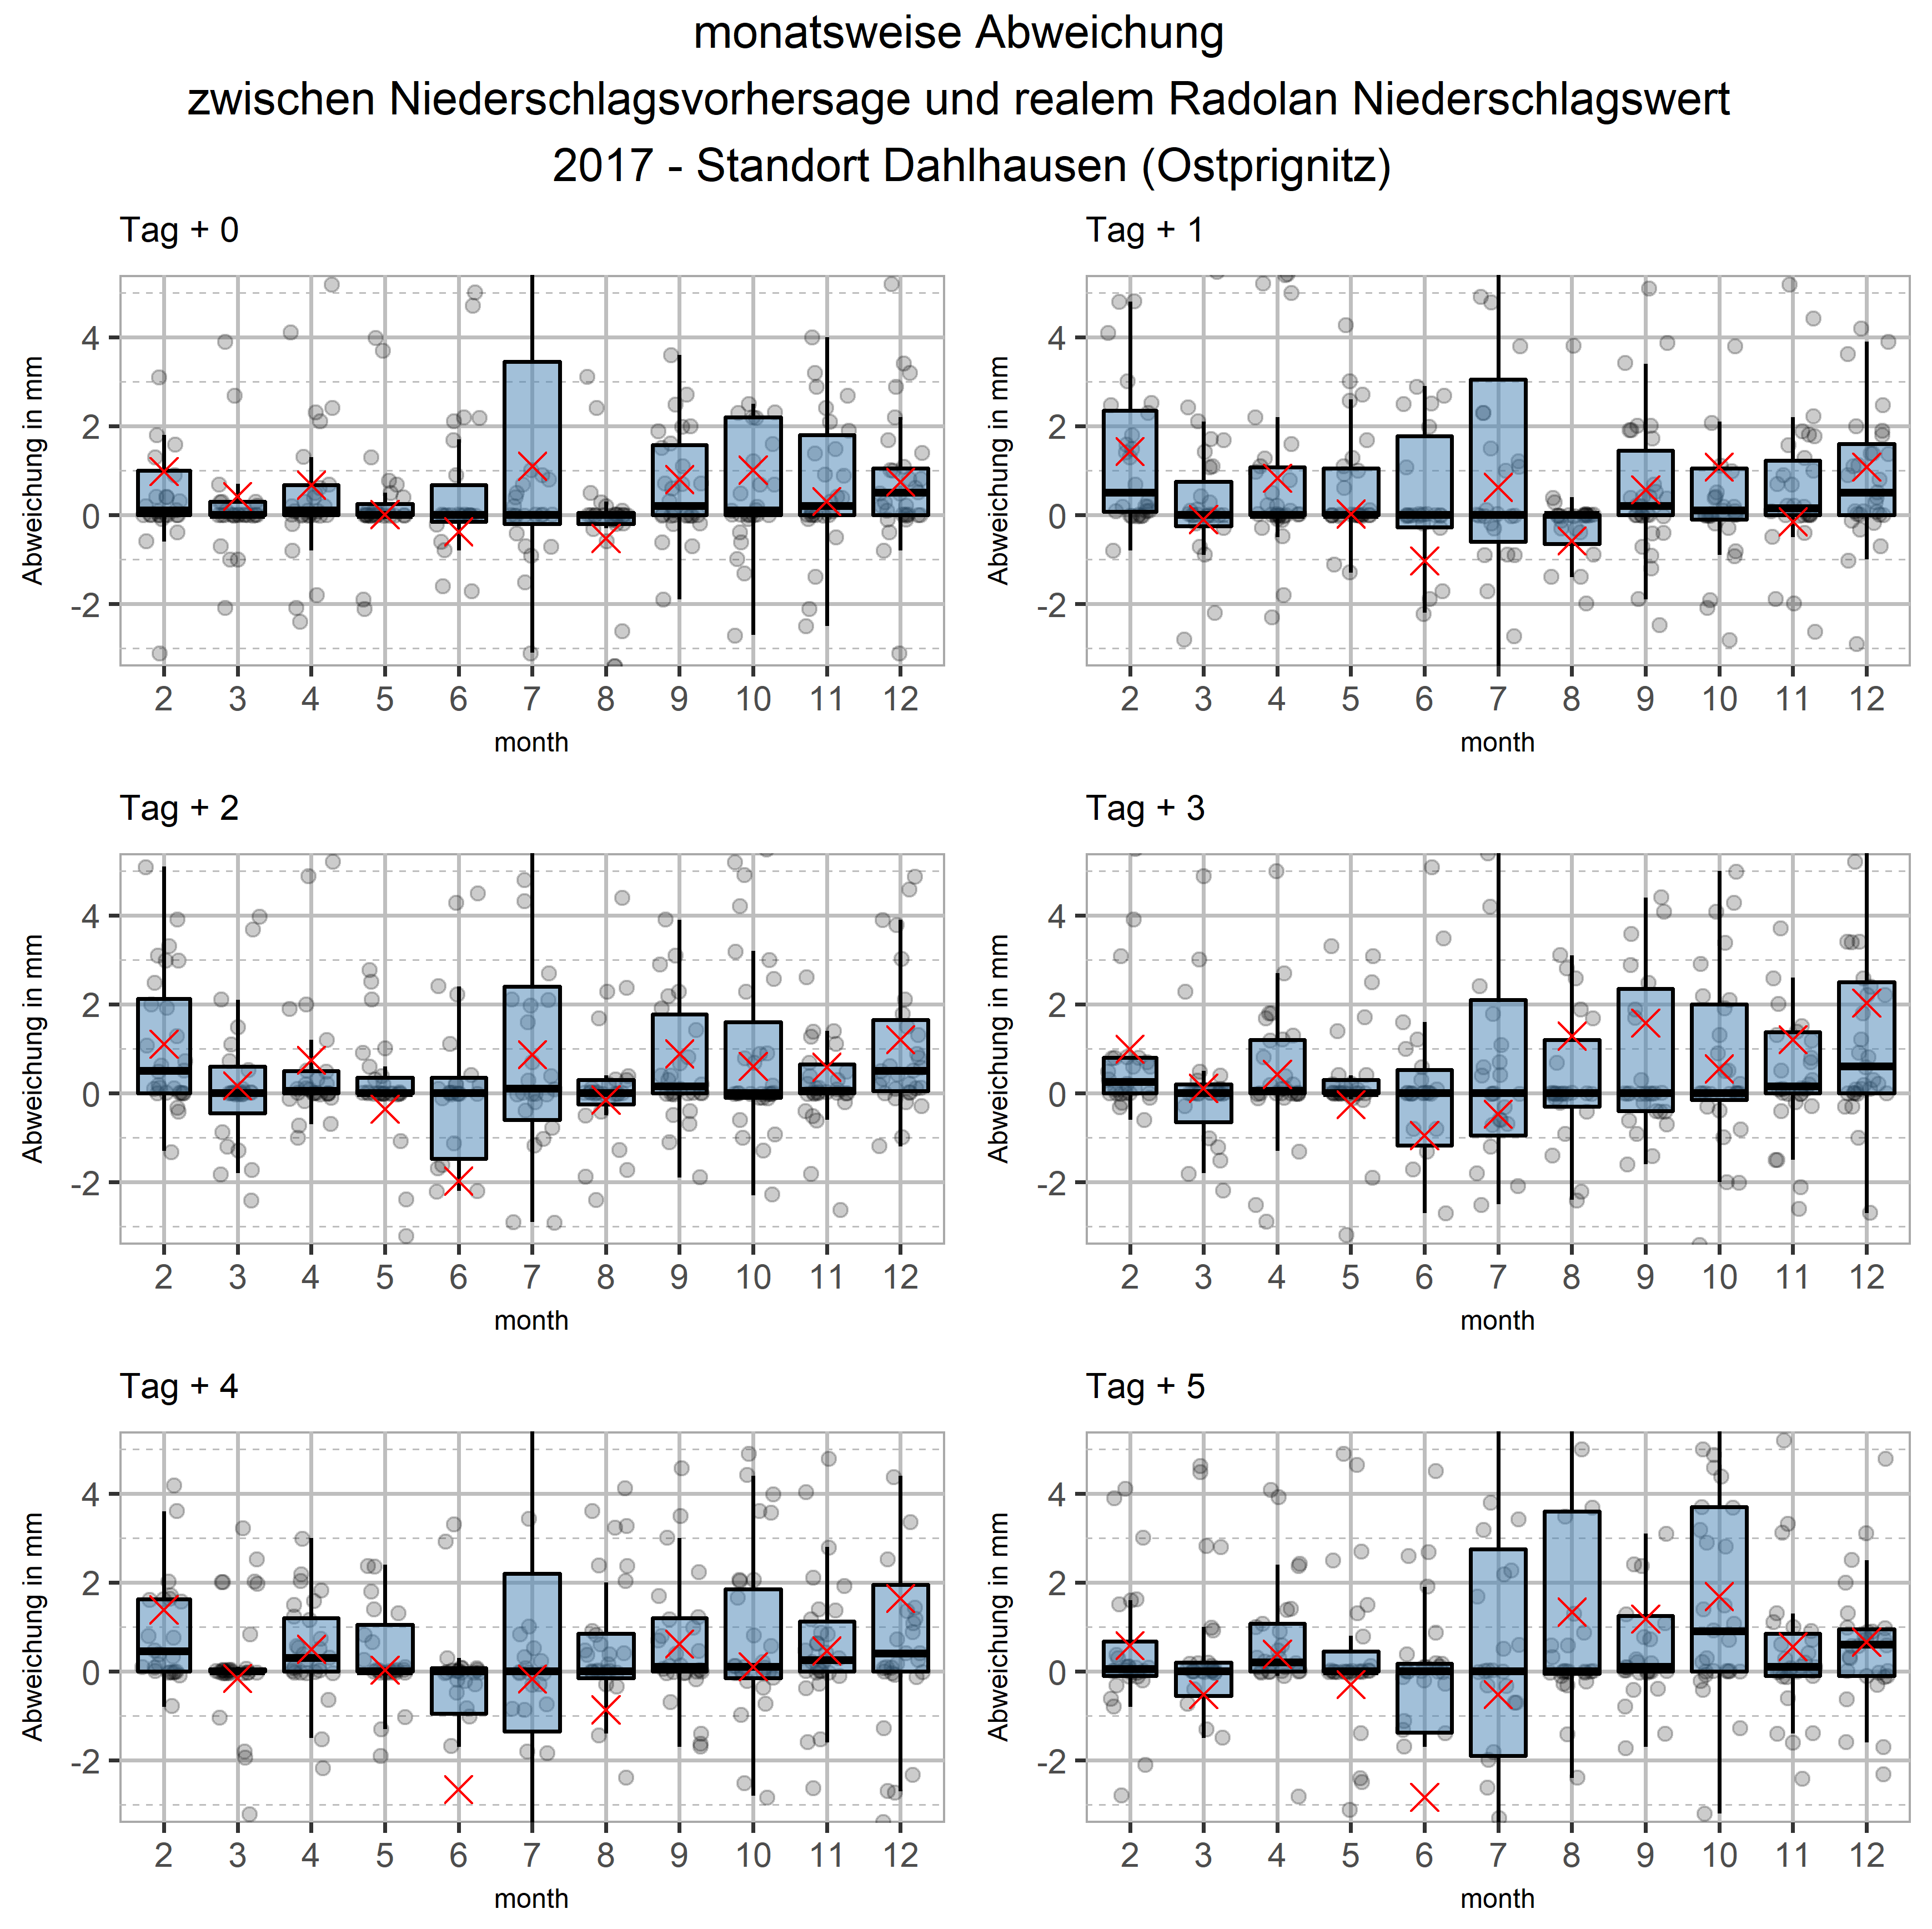
- The deviations in the individual months are distributed differently. This shows that heavy precipitation events in particular are less accurately forecast than moderate precipitation. This applies, for example, to the months of July and August 2017.
- The average deviations over the entire period are generally justifiable in relation to irrigation recommendations and tend to suggest a reliable water supply for the plant population if the forecasts are followed.
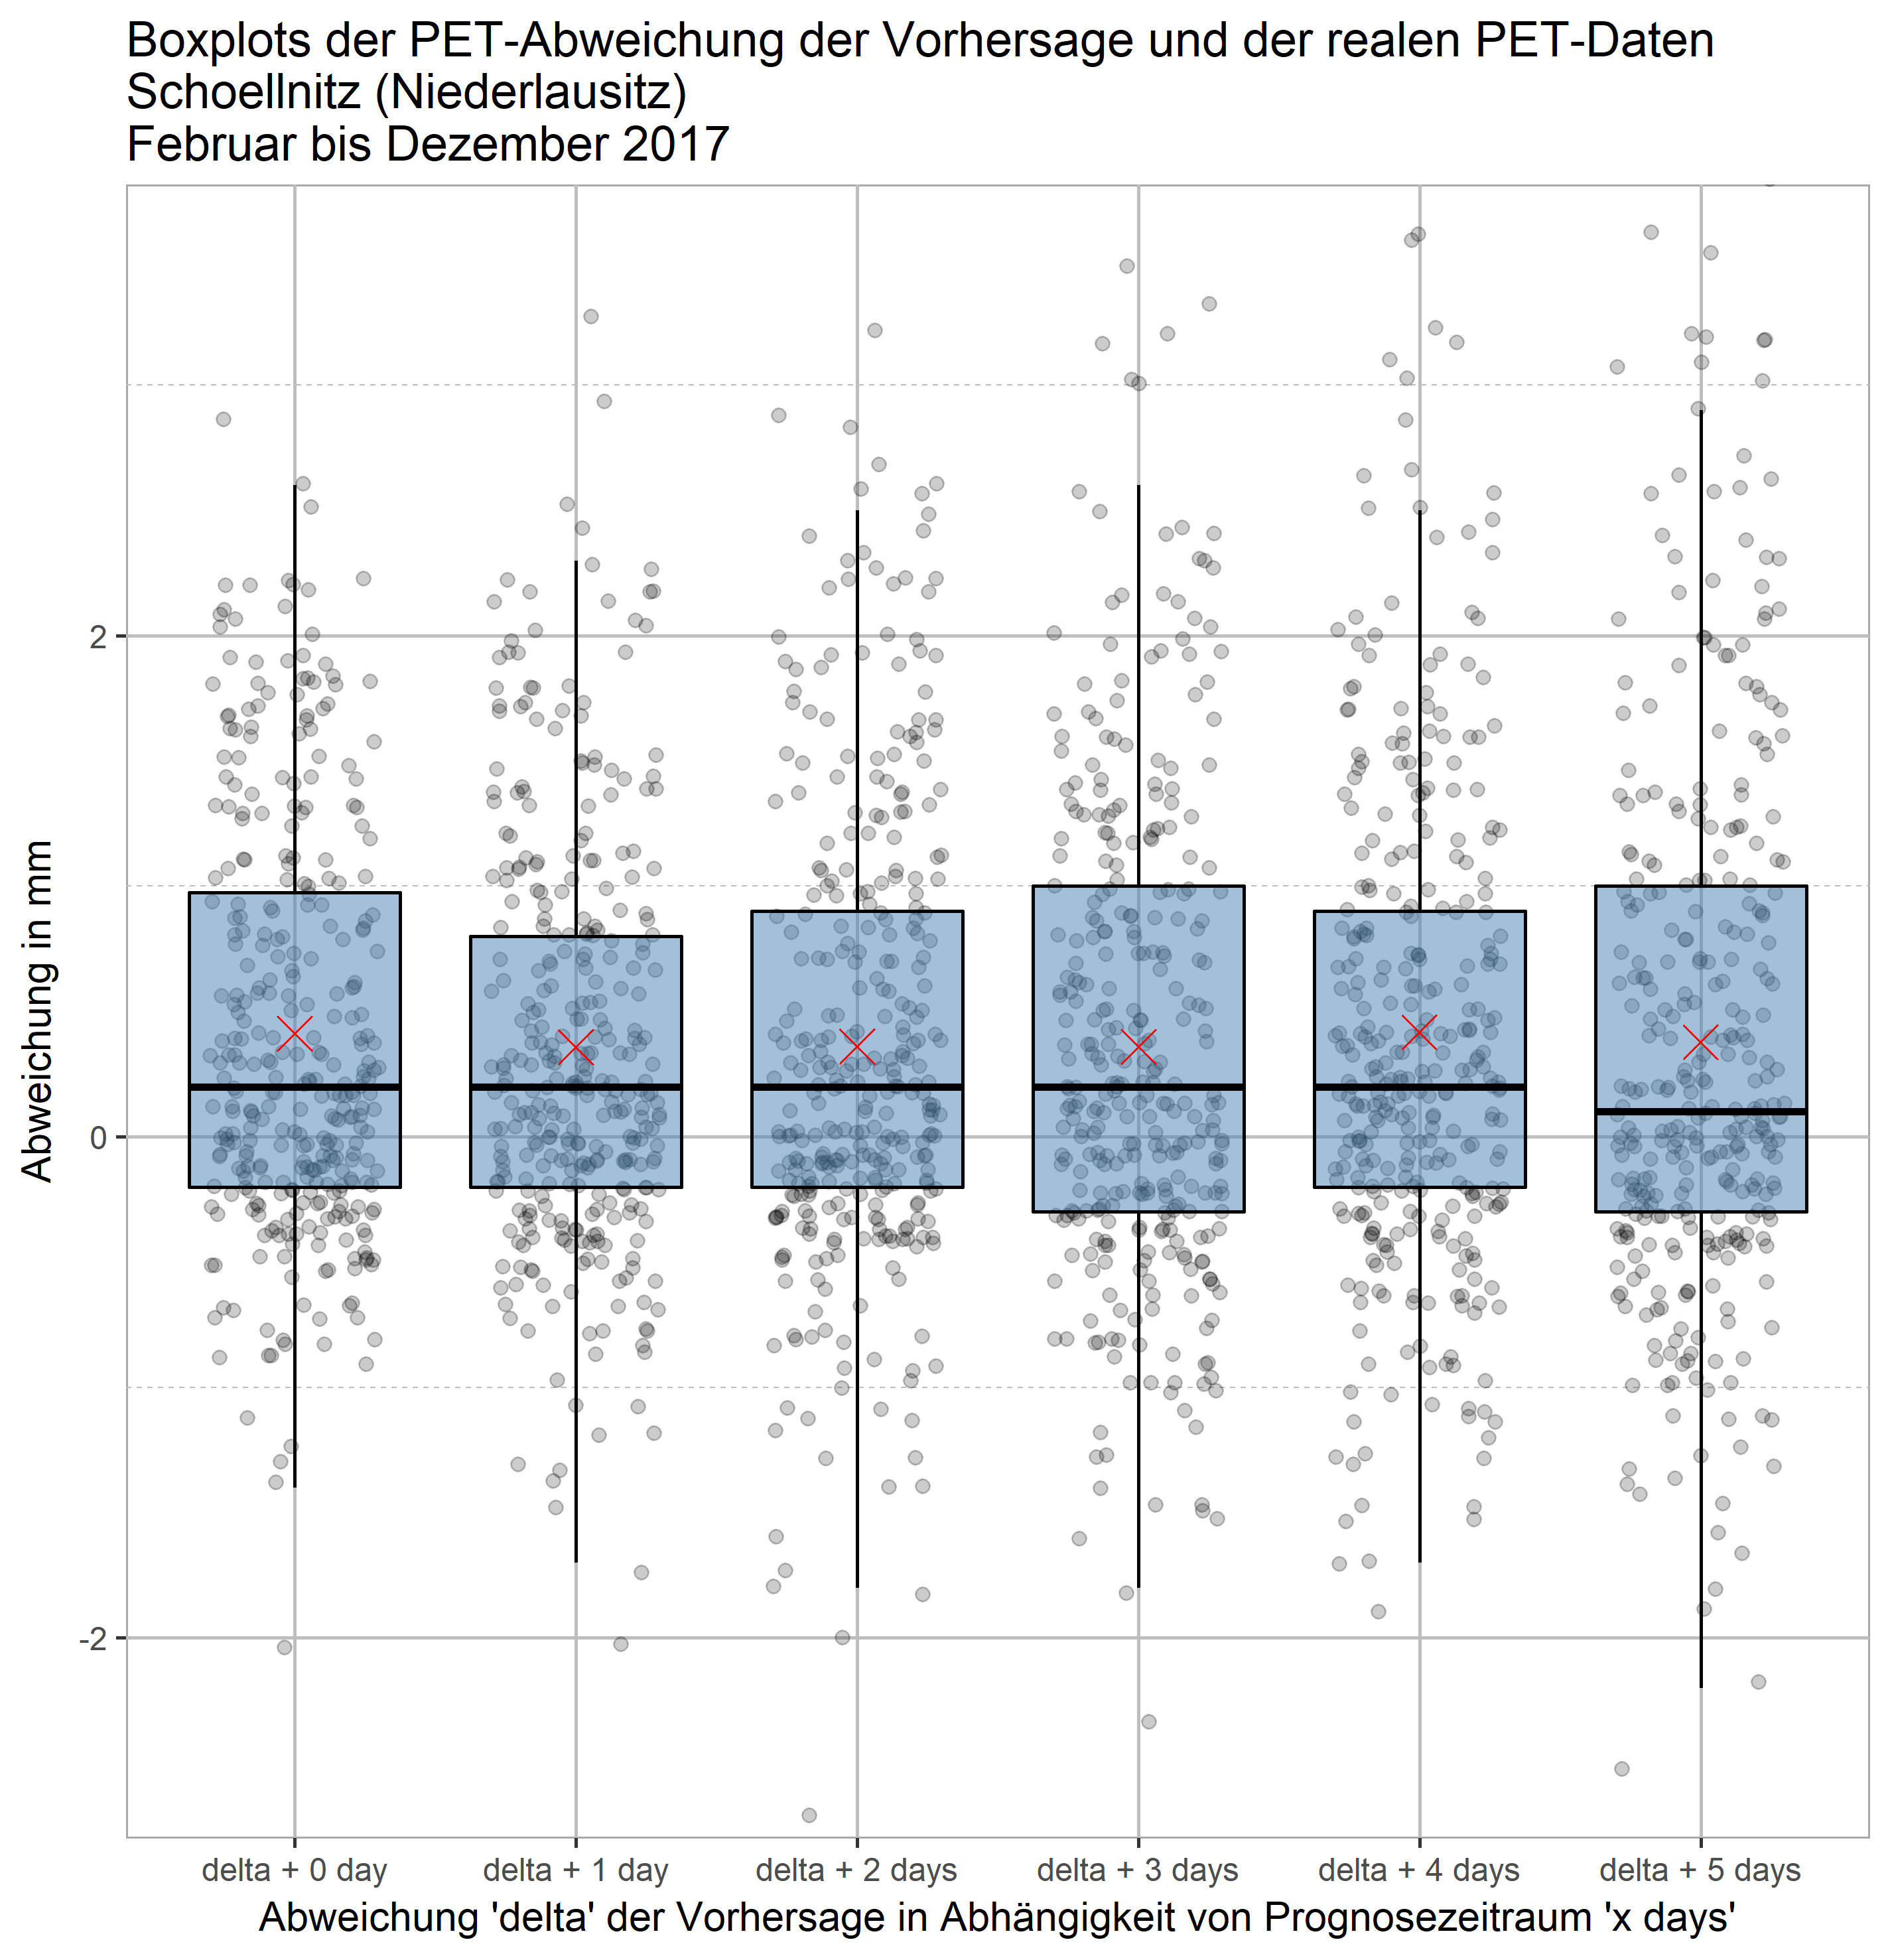
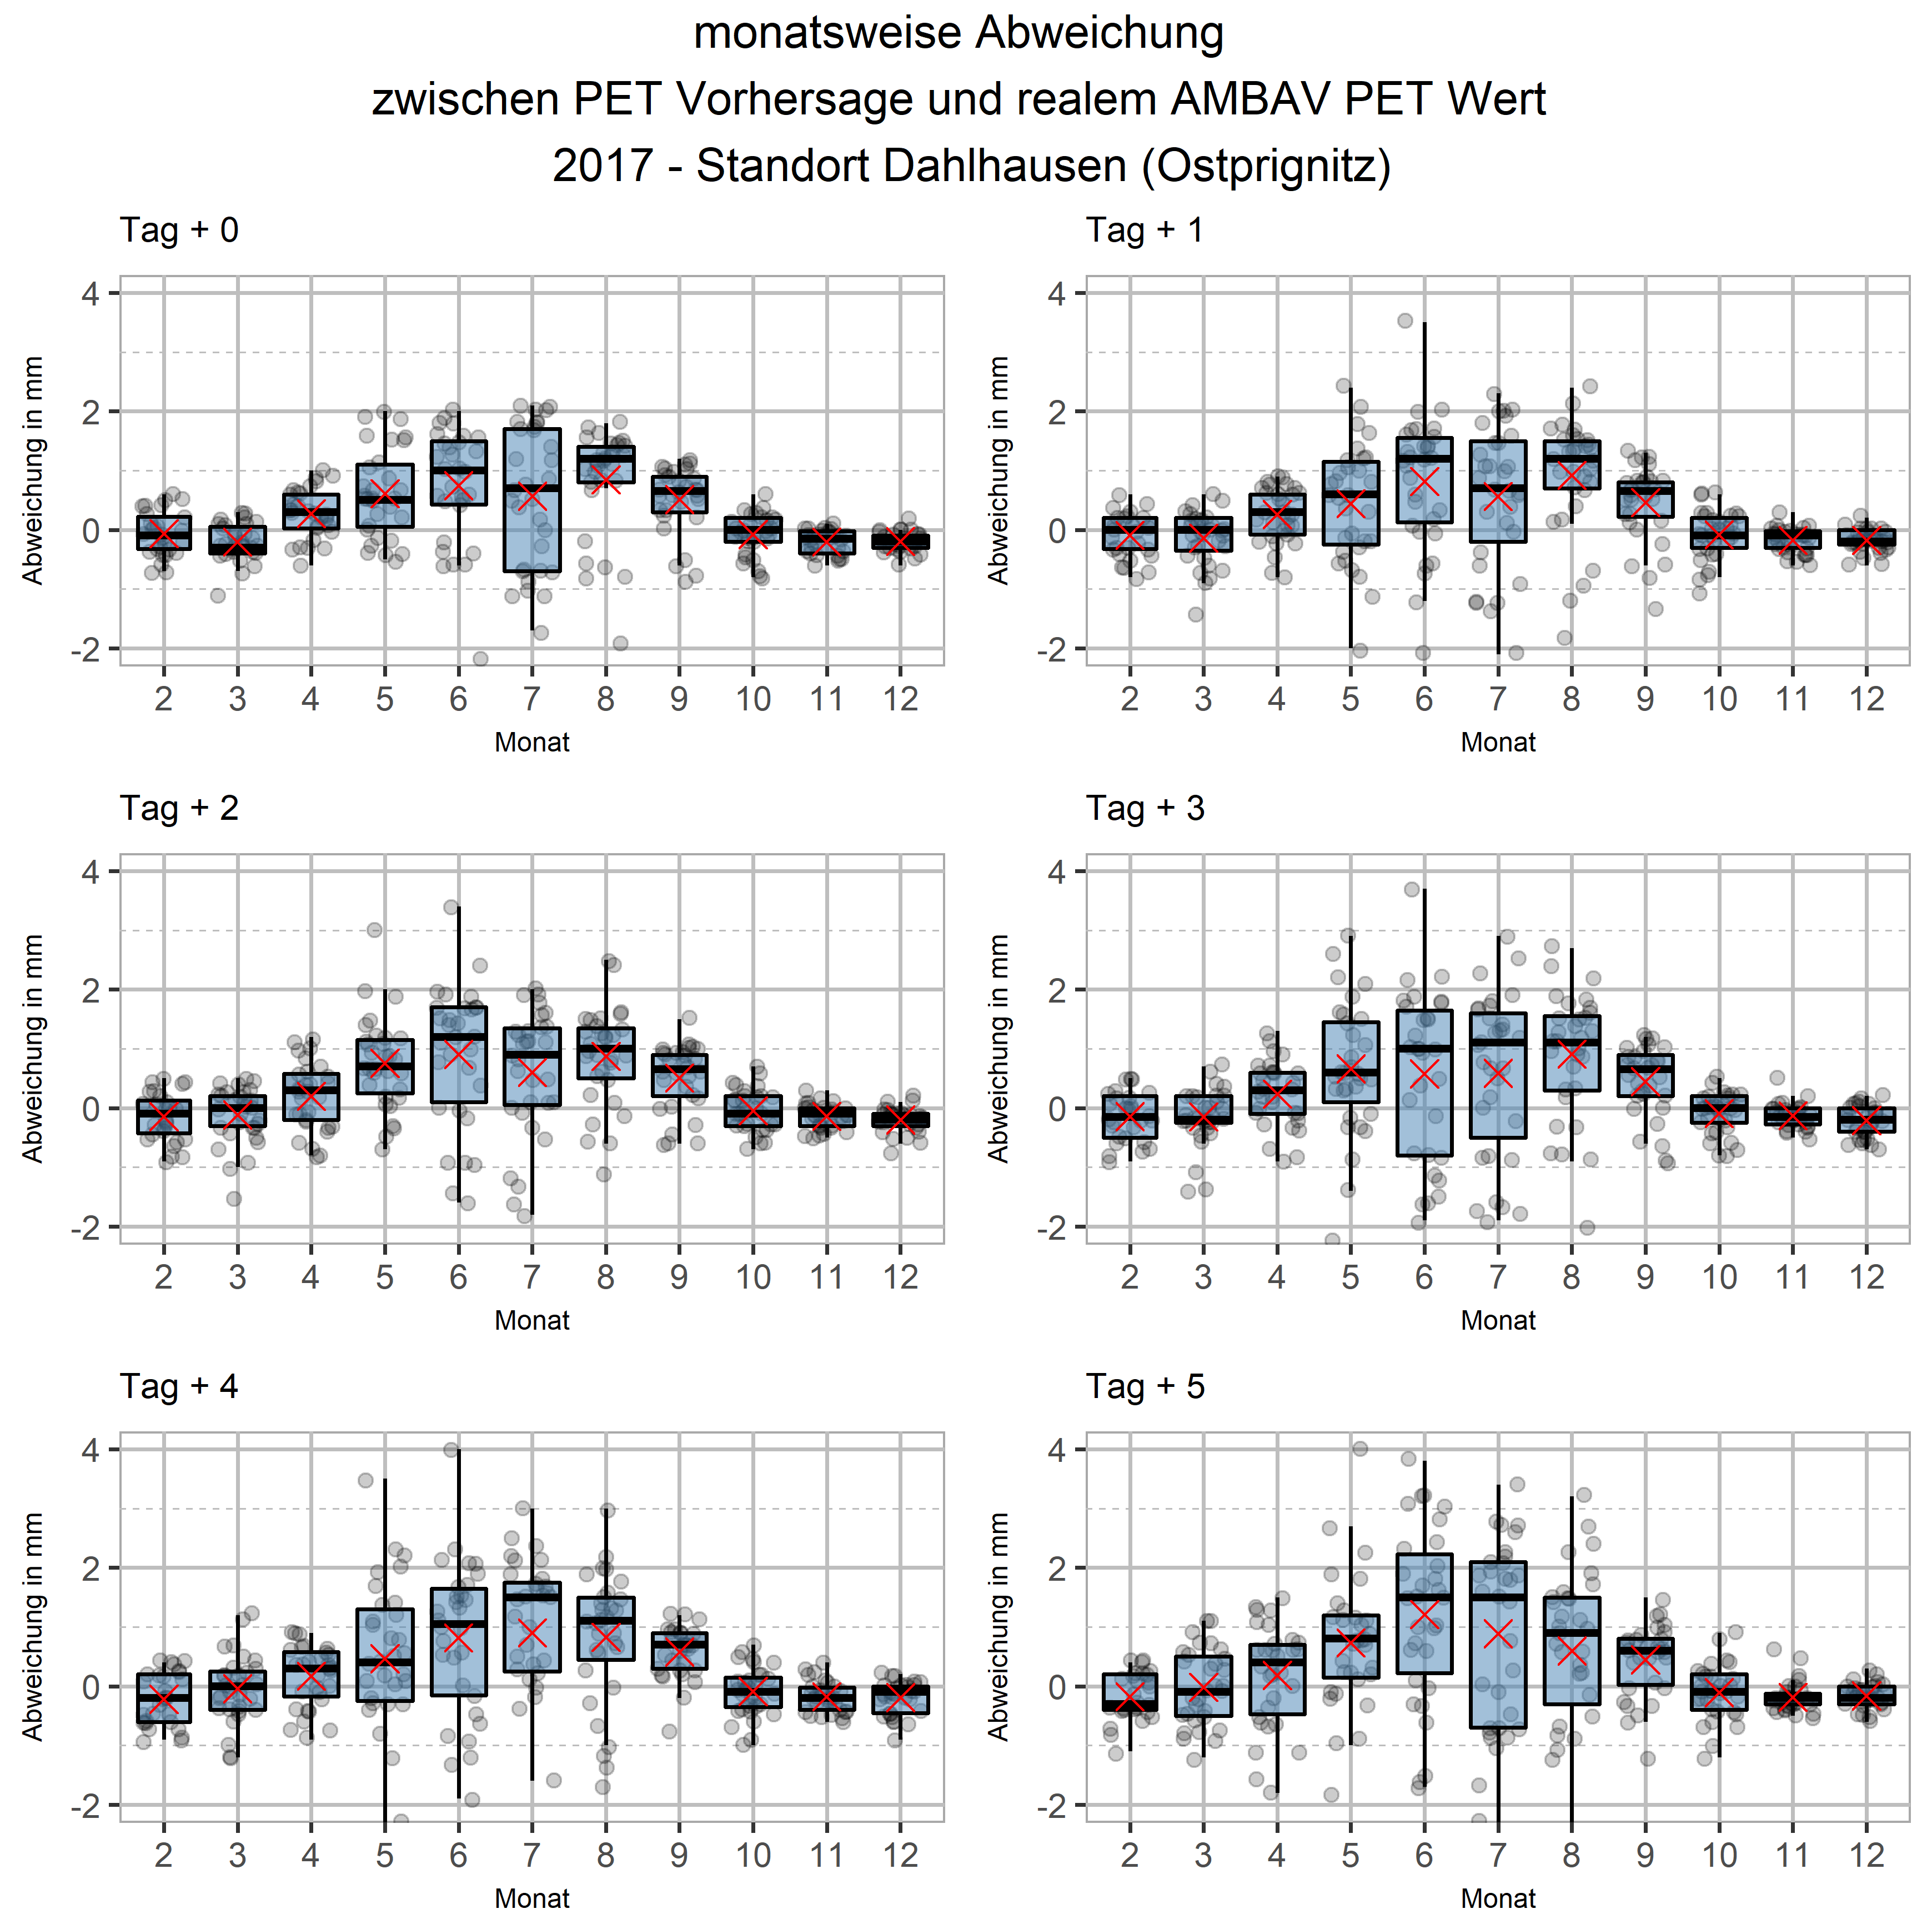
Potential Evapotranspiration (PET)
The evaluation showed that the modelled/predicted values of PET show comparatively high variation over a period of 6 days in advance. This is partly due to seasonal variability and partly to the complexity of determining the AMBAV value. The observation period here is February to December 2017.
The following statements have to be made
- An exact prediction of the PET value is relatively unlikely.
- There are seasonal fluctuations in the deviations, which are greatest in summer.
- Real PET values tend to be overestimated.
- a decreasing accuracy of the forecasts with increasing forecast period can be observed.
- Throughout, only about 5% of events are accurately predicted (deviation = 0mm).
- Approx. 50% of the predictions usually cover a range from -0.5 to approx. +0.5 mm within the period February to December 2017.
- about 75% of the forecasts cover a range from -1 to +1 mm within the period February to December 2017.
- During the summer months July to August 2017, on average about 50% of the forecasts cover a fluctuation range from 0 to about 2 mm with increasing accuracy of short-term forecasts.
- For the location of Ostprignitz, the forecasts consistently show higher accuracies compared to the location in Lower Lusatia.
- The tendency to overestimate the occurrence of PET in the summer months is justifiable insofar as the forecasted water demand is rather overestimated and, if the forecasts are taken into account in irrigation control, a reliable water supply for the plant population is probable.


What does dryness actually mean?
Often people speak of “dryness” or “dry years” or “dry summers”.
But what does this actually mean? Is there a uniform definition?
What dryness means depends on the context you are looking at. A meteorological dryness can exist but also a dryness of the soil can be considered.
aridity of the soil
Soil dryness may mean that the soil has a lower usable field capacity than a certain threshold value over a longer period of time. For example, this threshold can be 50%. Drought stress symptoms are generally to be expected for plants here. However, the considered depth of the soil is also important. Soil dryness is therefore also dependent on which plant species are considered. An average number of days during which this occurred can be determined over a previous period of time. If the number is now lower in the current period, one can already speak of a drought.
Drought of the weather (meteorological drought)
Here you can try to look at the deviations from long-term mean values of a series, e.g. a 30-year series. The time frame to be considered is relevant. Therefore dry years, seasons but of course also months or whole decades can occur. The latter usually causes drought catastrophes.
When does it start to be dry?
This question can only be answered statistically and justified.
According to DIN 4049, a dry year exists when the annual precipitation of a year is less than the arithmetic mean of a time series minus the standard deviation.
The DWD, especially the Agrarmeteorolgie, considers a dry period, for example a year, as dry, with which a quantity of precipitation falls, which is smaller than the 20% percentile of a reference series. This is statistically less than the DIN 4049 definition, because the standard deviation is the 33 1/3% percentile of a normally distributed series.
Due to the statistical distribution of precipitation, which usually has no statistical normal distribution, the situation occurs that both values are similar and differ by only a few mm. This is also the case if the median, i.e. the 50% percentile, is used to determine dryness thresholds according to DIN 4049.
| Mittelwerte des Niederschlages in der Periode | ||||||
|---|---|---|---|---|---|---|
| Quelle DWD CDC | annuell | Frühjahr | Sommer | Herbst | Winter | |
| Deutschland | 1986-2017 | 806,9 | 175,4 | 246,2 | 194,4 | 190,5 |
| Brandenburg | 1986-2017 | 585,8 | 124,3 | 196,5 | 132,9 | 132,9 |
| Schwellenwerte [mm] für Niederschlagstrockenheit der Periode im Vergleich zur Situation | ||||||
| Deutschland | annuell | Frühjahr | Sommer | Herbst | Winter | |
| DIN 4049 | 1986-2017 | 713,6 | 135,8 | 208,4 | 147,1 | 145,2 |
| DWD | 1986-2017 | 721,9 | 135,8 | 220,1 | 152,3 | 147,8 |
| Situation | 2017 | 858,7 | 157,9 | 307,3 | 224,6 | 116,4 |
| Brandenburg | ||||||
| DIN 4049 | 1986-2017 | 492,6 | 90,3 | 145,9 | 95,8 | 99,4 |
| DWD | 1986-2017 | 511,5 | 89,6 | 155,7 | 99,3 | 104,0 |
| Situation | 2017 | 719,1 | 114,3 | 319,3 | 173,5 | 116,6 |
So there are very different approaches to what a “dry month” or a “dry spring” can mean, for example. Looking at precipitation, the two definitions presented have similar “thresholds” from which one can speak of a “dry year” or a “dry spring”, for example.
It turns out that 2017 was wetter than the average, spring in Brandenburg drier than the average but no “dry spring” according to both definitions. Winter 2016/2017 for Germany can be described as a “dry winter”. The Brandenburg winter “only” below average.